Climate Change Response (Disclosure Based on TCFD Recommendations)
TCFD Initiatives
As global environmental issues grow increasingly severe, companies in Japan and around the world are being called on to reduce the environmental impact of their operations. Fuji Soft is committed to doing its part, and in 2023 declared its support of the Task Force on Climate-related Financial Disclosures (TCFD). That same year, we converted all of our data centers and roughly 80% of our offices to electricity generated from renewable energy sources. In line with the Japanese government’s goal of achieving carbon neutrality by 2050, as well as international environmental policies, social demands, and evolving circumstances, we have created a sustainability promotion framework for systematically reducing our environmental impact while monitoring how these efforts affect our performance.
Governance
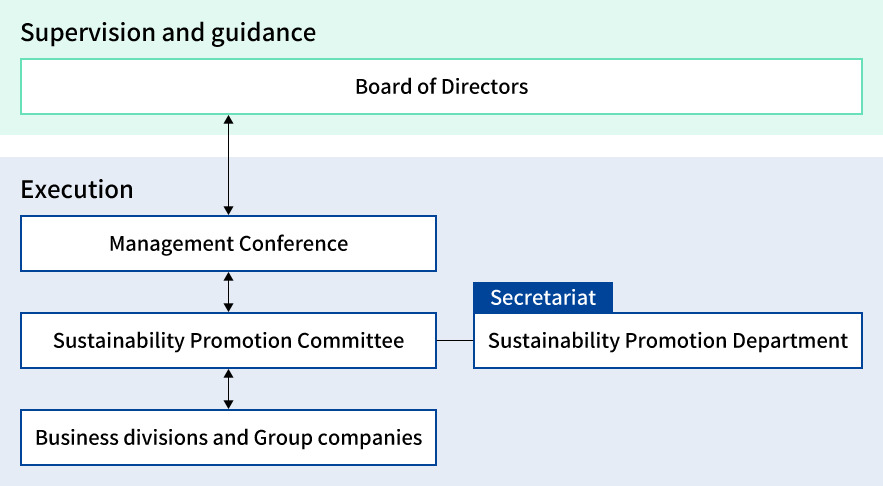
The Board of Directors created the sustainability promotion framework and oversees company-wide initiatives to address climate change and other sustainability issues. These initiatives are also positioned as key drivers of the Company’s long-term corporate value.
Sustainability promotion framework
| Meetings | Purpose |
|---|---|
| Board of Directors (monthly) | Resolve important matters concerning sustainability, supervise and advise, and regularly receive reports on sustainability meeting content. |
| Sustainability Promotion Committee (quarterly) | Advance sustainability activities to fulfill our social responsibilities. Identify issues related to sustainability, direct departmental activities, and report progress to the Management Conference. The committee is chaired by the officer in charge of sustainability and participated by officers of each department. |
Strategy
We analyze both the 1.5°C and 4°C scenarios qualitatively and quantitatively to examine how events caused by climate change will affect our future business activities. This assessment is conducted in accordance with the following scenario analysis.
| Scope of reporting: The Fuji Soft Group (Japan and overseas) |
Implementation of scenario analyses: October 2023 | |
|---|---|---|
| Item | 4˚C scenario | 1.5˚C scenario |
| Time frame of the scenario | 2030 and 2050 | |
| Key scenarios used as references | IEA Stated Policies Scenario IPCC RCP8.5 |
IEA Net Zero Emissions by 2050Note: The 2˚C scenarios mentioned below also serve as references. IEA Sustainable Development Scenario, IPCC RCP2.6 |
| Worldview of the scenario | Climate change countermeasures are maintained at the current level while increasingly severe abnormal weather events and other phenomena cause physical damage. | More ambitious climate change countermeasures (e.g., through legal regulation) aimed at promoting decarbonization are enacted. |
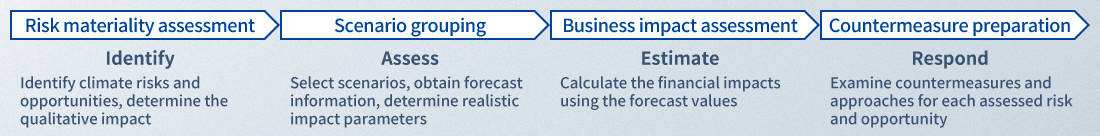
In the course of executing our scenario analyses, we have taken both the qualitative and quantitative aspects of climate change impact into account with reference to “Recommendations for the Formulation of Management Strategies via the Use of the TCFD” (issued by the Ministry of the Environment in March 2023). Specific analytic steps are as listed below.
The list of expected risks and opportunities
As a result of scenario analysis, the Company has identified climate change-related risks and opportunities arising from our business operations as listed below. In the course of identification and assessment, we have given consideration to the SASB standard, the macroeconomic environment, market Status and the Company’s medium-term management plan.
| Large categories | Medium categories | Small categories | Considerations | Timespan | 1.5˚C | 4˚C |
|---|---|---|---|---|---|---|
| Risks | Transition | Introduction of carbon pricing | Due to the introduction of carbon pricing, operational costs could increase in step with growth in the volume of greenhouse gas (GHG) emissions from the Company’s operations. | Medium to long term | Large | — |
| Regulations on plastics | Manufacturing costs for the Company’s robotic products could rise due to the enforcement of regulations limiting the circulation of fossil-based plastics and the switchover of materials to biodegradable plastics. | Medium to long term | Medium | — | ||
| Regulatory policies regarding energy use | Statutory limitations may be placed on the use of energy derived from fossil fuels. At the same time, businesses could be obliged to reduce energy consumption volumes. The above regulations will lead to growth in electricity costs in general, while businesses may have to increase expenditure on energy-saving facility updates. Furthermore, office rents could be upwardly revised in step with the switchover to ZEB, leading to growth in expenses. |
Medium to long term | Large | — | ||
| Advance in low-carbon technologies | Demand for semiconductors could exceed supply on the back of the popularization of xEVs and renewable energy. This may lead to delays in the development and delivery of the Company’s products and a resulting decline in profit if an incident that makes it hard to procure semiconductors should occur. | Medium to long term | Small | — | ||
| Technological investment | If the Company fails to remain on-trend with the transition to a decarbonized society and lags behind its peers in terms of investment in and the development of green IT, it could begin losing customers to competitors. The failure could thus result in the deterioration of our competitiveness as well as a decline in profit. | Short to long term | Large | — | ||
| Changes in energy costs | Fluctuations in electricity rates and crude oil prices could result in growth in the Company’s operational costs. | Short to long term | Medium | — | ||
| Impact of reputational damage | If the Company fails to take sufficient steps to counter climate change, its reputation among customers and investors may deteriorate. This could, in turn, lead to a decline in sales while making it hard to secure funding. | Medium to long term | Large | — | ||
| Physical | The increasing severity of abnormal weather | • The increasing severity of abnormal weather could cause Company-owned buildings, offices and data centers to suffer damage, leading to delays in or the suspension of business activities. Moreover, the Company may have to record expenses for preventive measures aimed at curbing disaster-related damage and, if an emergency occurs, execute outlays for measures to restore its operations. • When transactional partners suffer disaster-related damage, the Company may face a decline in sales or a difficulty in recovering rents. |
Short to long term | Large | Large | |
| Drought | The increasing frequency of drought could make it more difficult to procure semiconductors and result in delays in the development and delivery of Company products, leading to a decline in profit. | Medium to long term | — | Small | ||
| Rises in average temperatures | Rises in air temperatures could expose employees to a growing risk of heat stroke, while the use of air conditioning systems at offices and data centers could be ever more frequent in order to mitigate such risk, resulting in higher operational costs. | Medium to long term | Medium | Medium | ||
| Growing incidence of infectious disease | An increase in the incidence of infectious disease could expose employees to a growing risk of illness. | Medium to long term | — | Small |
| Large categories | Medium categories | Small categories | Considerations | Timespan | 1.5˚C | 4˚C |
|---|---|---|---|---|---|---|
| Opportunities | Transition | Forest protection policies | The strengthening of forest protection policies could result in stronger demand for products and services designed to support a shift to paperless operations. | Medium to long term | Medium | — |
| Regulatory policies regarding energy use | Customers may seek data centers (especially facilities powered by renewable energy) in order to curb the volume of energy consumption and Scope 3 emissions. This could bring a growing number of profit opportunities to the Company. | Medium to long term | Medium | — | ||
| Other legal regulations | The Company’s sales may increase via the provision of products and services designed to meet demand associated with the promotion of smart factories / logistics. | Medium to long term | Medium | — | ||
| The popularization of renewable energy and energy-saving technologies | The Company’s sales may increase via the provision of products and services designed to meet growing demand for xEVs. At the same time, demand for power control systems may increase on the back of ever-stronger demand for energy-saving solutions. | Short to long term | Large | Medium | ||
| Advance in low-carbon technologies | In step with growth in demand for technologies (mitigation measures) capable of contributing to decarbonization, the Company may benefit from an increasing number of profit opportunities in its business domains. | Medium to long term | Large | — | ||
| Technological investment | If the Company responds appropriately to a shift to a decarbonized society and robustly undertakes investment in and the development of green IT, it could benefit from a growing number of profit opportunities in addition to preventing the outflow of its customers. | Medium to long term | Large | — | ||
| Changes in reputation among customers | If the Company takes a proactive approach to countering climate change and successfully earns robust external reputation, it could garner more favorable ratings from customers and investors. This will, in turn, enable the Company to enjoy higher sales and secure stable funding. | Medium to long term | Large | — | ||
| Physical | The increasing severity of abnormal weather | • Due to the impact of climate change, demand for weather prediction technologies could become stronger in the agricultural sector. This could make relevant Fuji Soft technologies sought after. • The trend toward refraining from going out may result in the expansion of online sales and, accordingly, lead to growing demand for EC website development services. This same trend may also cause a growing number of businesspeople to opt for teleworking and stimulate demand for relevant products and services. |
Short to long term | Large | Large | |
| Changes in rainfall patterns and other weather phenomena | Growing needs for countermeasures against droughts could facilitate the use of ICT (e.g., automated water management) in the agricultural sector. This could result in stronger demand for relevant Fuji Soft technologies. | Medium to long term | — | Medium | ||
| Growing incidence of infectious disease | The growing incidence of infectious disease could result in the widespread popularization of teleworking and lead to growth in demand for relevant products and services. | Medium to long term | — | Medium |
Timespan
Short term: zero to three years; Medium term: four to 10 years; Long term: 11 years or longer
Monetary impact
(Blue typeface) Large: over ¥100 million; Medium: over ¥10 million; Small: under ¥10 million
(Black typeface)Large: qualitatively large; Medium: qualitatively medium; Small: qualitatively small
“—” indicates that no impact has been estimated or that the impact is expected to be minor
Estimated financial impact
The potential financial impact of each risk and opportunity was calculated for items that can be reasonably estimated using external parameters and actual Company data.
Based on our preliminary calculations, we do not expect any risks that would significantly impact our business activities. We believe our ongoing efforts toward carbon neutrality will mitigate the impact of a carbon tax. (Countermeasures for floods and storm surges are discussed below.) In terms of business opportunity, in addition to the two items considered here, we expect growing demand for green IT that supports decarbonization and digital transformation that improves business efficiency. We anticipate that these trends will expand our business domains and strengthen our sales and profitability.
| Scenarios | Calculation method | Outcome estimates (unit: million yen) | |||
|---|---|---|---|---|---|
| 2030 | 2050 | ||||
| 1.5°C | 4°C | 1.5°C | 4°C | ||
| Carbon tax impact Carbon tax applied to Scope 1 and 2 greenhouse gas emissions in 1.5°C scenarios for 2030 and 2050 |
Company GHG emissions × future carbon tax rate
・ Assuming 2030 GHG emission volume is the same as FY2022 ・ Referencing the carbon tax rate presented in the Net Zero Emissions by 2050 Scenario of IEA World Energy Outlook 2022 (WEO 2022) |
(254.7) | 0 | (454.8) | 0 |
| Electricity rate change impact Higher electricity rates on power used by the Company in the 1.5°C scenarios for 2030 and 2050 |
Electricity consumption × Future electricity rate
・ Assuming 2030 electricity consumption is the same as FY2022 ・ Referencing the electricity rate presented in the IEA WEO 2019 Sustainable Development Scenario |
(57.1) | 26.6*1 | (60.9) | 49.5*1 |
| Change in air conditioner usage Increasing use of air conditioning due to rising average temperatures in the 1.5°C and 4°C scenarios for 2030 and 2050 |
Percentage increase in air conditioning usage × future electricity rate
・ Estimated air conditioning electricity usage based on the share of air conditioning in total electricity consumption by business type (Agency for Natural Resources and Energy) ・ Percentage increase in air conditioning usage due to rising temperatures, referencing from IEA The Future of Cooling ・ Referencing the electricity rate presented in the IEA WEO 2019 Sustainable Development Scenario |
(5.2) | (12.2) | (16.4) | (41.4) |
| Flood and storm surge damage cost Increased physical damage and flooding at our business sites caused by more intense extreme weather in the 1.5°C and 4°C scenarios for 2030 and 2050 |
Percentage of damage × value of each asset
・ Determine percentage of potential damage for each site using local government hazard maps ・ Estimate damage using the calculation method in the Manual for Economic Evaluation of Flood Control Investment (Ministry of Land, Infrastructure, Transport and Tourism) ・ Calculate flood or storm surge damage as the average single-year loss multiplied by the annual exceedance probability |
(214.2) | (608.7) | (304.9) | (919.7) |
*1 Lower electricity rates are expected to reduce costs
| Scenarios | Calculation method | Outcome estimates (unit: million yen) | |||
|---|---|---|---|---|---|
| 2030 | 2050 | ||||
| 1.5°C | 4°C | 1.5°C | 4°C | ||
| xEV market growth Increased demand for Company products due to an expanding market for electric vehicles, fuel cell vehicles, and other forms of vehicle electrification (collectively: xEVs) in the 1.5°C scenarios for 2030 and 2050 |
Automotive business operating income × xEV market growth percentage
・ Estimate based on FY2022 automotive business sales and operating income ・ Referencing xEV market growth presented in the Net Zero Emissions by 2050 Scenario of IEA WEO 2022 |
294.4 | -*2 | 1,240.0 | -*2 |
| Growing demand for energy conservation Increasing demand for Company power control products due to increasing electrification accompanying growing demand for energy conservation in the 1.5°C and 4°C scenarios for 2030 and 2050 |
Operating income in electric power related business × percentage change in electricity generation volume
・ Assuming that growth in electricity generation volume will lead to increase in electric power related business ・ Referencing the IEA WEO 2022 Stated Policies Scenario and Announced Pledges Scenario for the change in electricity generation volume |
21.7 | 18.7 | 94.6 | 61.8 |
*2 Cannot be estimated due to lack of parameters
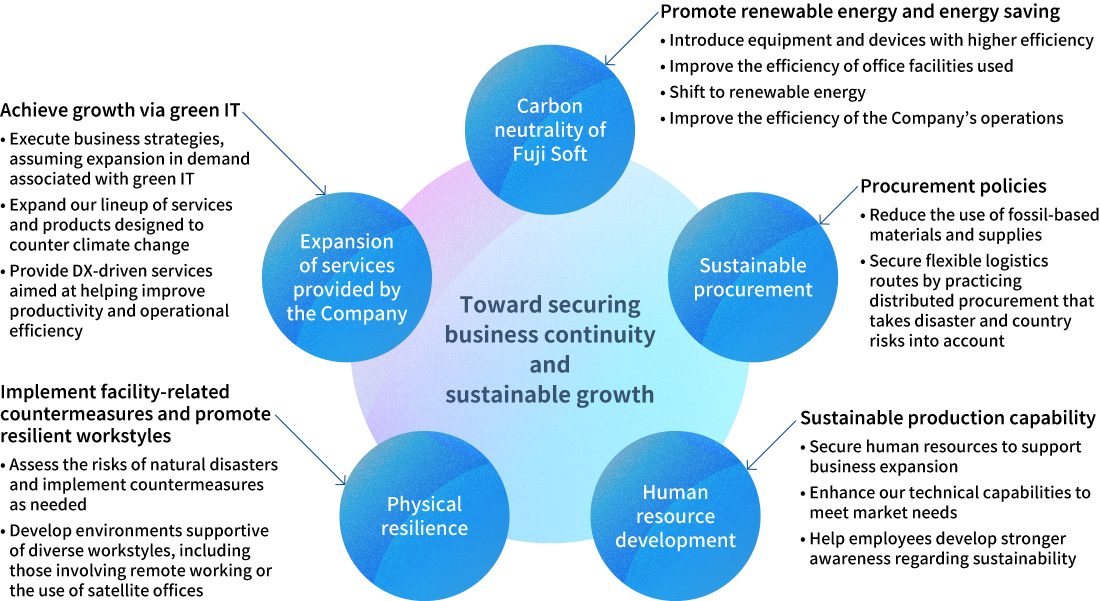
Response to the risks and opportunities identified
Having classified our policies regarding our response to the risks and opportunities identified into five categories, we discussed specific initiatives deemed viable at this point of time and related policies.
Risk management
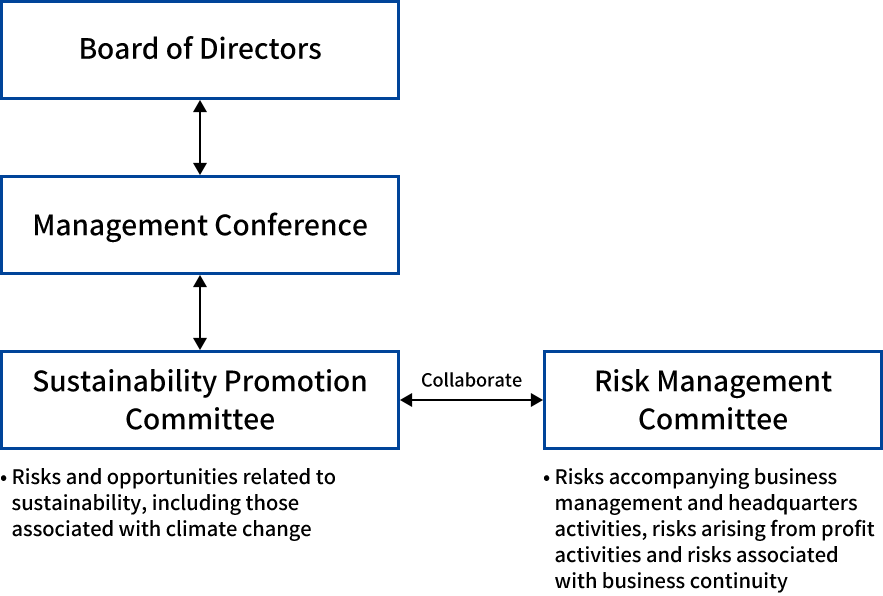
The Sustainability Promotion Committee identifies and assesses the potential impacts of climate risks and opportunities associated with the Company’s business activities. The committee then works closely with the Risk Management Committee, which oversees company-wide risks, to create management plans for the risks and opportunities.
The Sustainability Promotion Committee reviews all risks and opportunities to the Company’s sustainability. Climate-related issues are assessed both qualitatively and quantitatively, referencing questions raised by external assessment organizations and incorporating scenario analysis. These evaluations consider short-, medium-, and long-term time horizons as well as occurrence likelihood and projected parameters.
Moreover, the Company has established the Risk Management Committee, which is tasked with the management of Companywide risks. This committee has formulated in-house rules stipulating action standards for non-emergency and emergency situations while also monitoring the management status of various risks arising from operations undertaken by each division. In this way, the committee strives to curb risks that may affect business management to a minimum level. The Risk Management Committee meets on a quarterly basis. Including the heads of all headquarters divisions, the committee operates a PDCA cycle encompassing the confirmation of risk incidents (including those additionally identified), the identification of issues, deliberations on countermeasures, the implementation of countermeasures and the assessment of their outcomes. Through these activities, the committee endeavors to develop a structure capable of ensuring compliance with laws, regulations, social norms and in-house rules and securing the appropriateness and efficiency of business operations. Furthermore, the status of activities undertaken by the committee is reported to the Management Conference so that the former’s input is utilized in business management.
Climate change-related risks discussed by the Sustainability Promotion Committee are reported and relayed to the abovementioned Risk Management Committee. Based on this structure, climate change-related risks undergo comparative assessments against other risks.
Risk management structure
| Meetings (frequency) | Roles |
|---|---|
| Risk Management Committee (quarterly) |
The officer in charge of the Legal Affairs & Audit Department serves as the chair, while the membership consists of the heads of all headquarters divisions. The committee establishes basic policies regarding risk management and undertakes cross-sectional monitoring of the Company’s overall operations. Through these efforts, the committee endeavors to keep risks that may affect business management to a minimum and contributes to the maintenance and enhancement of corporate value through its discussions. |
Metrics and targets
Fuji Soft closely monitors the greenhouse gas emissions generated by its business to better control and reduce the environmental impact of its operations. In line with the Japanese government’s goal of achieving carbon neutrality by 2050, we are promoting initiatives to use renewable energy, advancing digital transformation in our business processes, and improving operating efficiency. To manage our emissions more comprehensively, we are preparing to expand the calculation scope to include our consolidated subsidiaries.
| CO2 emissions by scope (t-CO2) | 2013 (Baseline) |
2022 (Actual) |
2023 (Actual) |
2024 (Actual) |
|
|---|---|---|---|---|---|
| Scope 1 and 2 Combined total | 17,168 | 16,577 | 8,651 | 4,384 | |
| Scope 1 | Direct emissions | 1,280 | 1,363 | 1,468 | 1,695 |
| Scope 2 | Indirect emissions | 15,888 | 15,214 | 7,184 | 2,689 |
| Percent reduction | Base year comparison | — | 3% | 49% | 74% |
Notes:
Baseline value uses the “adjusted greenhouse gas emissions” (April 2013 to March 2014) reported in the Energy Conservation Act Periodic Report for fiscal 2014.
Greenhouse gas emission calculation period changed to the January to December corporate fiscal year beginning in fiscal 2022.
The Company began systematically shifting its buildings to 100% renewable energy in November 2022.
Greenhouse gas emission reduction targets*
・ Reduce net emissions by 50% by 2030 compared to fiscal 2013 levels
・ Achieve net-zero emissions by 2050
* Fuji Soft non-consolidated Scope 1 and 2 emissions
| Scope 3 CO2 emissions (t-CO2)*1 | 2023 (Actual) |
2024 (Actual) |
||
|---|---|---|---|---|
| Process | Scope 3 | Total | 107,656 | 145,743 |
| Upstream | Category 1 | Purchased products and services | 77,409 | 85,859 |
| Category 2 | Capital goods | 16,527 | 46,428 | |
| Category 3 | Fuel and energy usage other than Scope 1 and 2 | 3,009 | 3,041 | |
| Category 4 | Transport & delivery (upstream) | 1 | 0 | |
| Category 5 | Business operation waste*2 | - | - | |
| Category 6 | Employee travel | 1,835 | 2,486 | |
| Category 7 | Employee commuting | 1,630 | 1,659 | |
| Category 8 | Leased assets (upstream)*3 | - | - | |
| Downstream | Category 9 | Transport and delivery (downstream) | 2 | 3 |
| Category 10 | Processing of products sold*3 | - | - | |
| Category 11 | Use of products soldCategory 12 | 594 | 670 | |
| Category 12 | Disposal of products sold | 1 | 0 | |
| Category 13 | Leased assets (downstream) | 234 | 2 | |
| Category 14 | Franchise*3 | - | - | |
| Category 15 | Investment | 6,412 | 5,594 | |
*1 Activity volume calculated by multiplying then rounding accounting data for each year’s January–December activity period by emission factors (values less than 0.5 are displayed as 0).
Emission factors calculated with reference to the following sources:
・ Global supply chain adjusted environmental impact based on the Global Link Input‑Output (GLIO) database
・ Inventory Database for Environmental Analysis (IDEA) ver. 3.1
・ Emissions factors provided by electric power companies
・ Emission Factor Database for Calculating Greenhouse Gas Emissions, etc., by Organizations throughout the Supply Chain (Ministry of the Environment) (Ministry of the Environment Database: Ver. 3.4/2023, Ver. 3.5/2024)
*2 Business operation waste is classified as Category 1
*3 A bar (“-”) indicates no applicable items
*4 Key growth factors in 2024: Increased product and services purchases, increased capital goods due to real estate acquisitions